

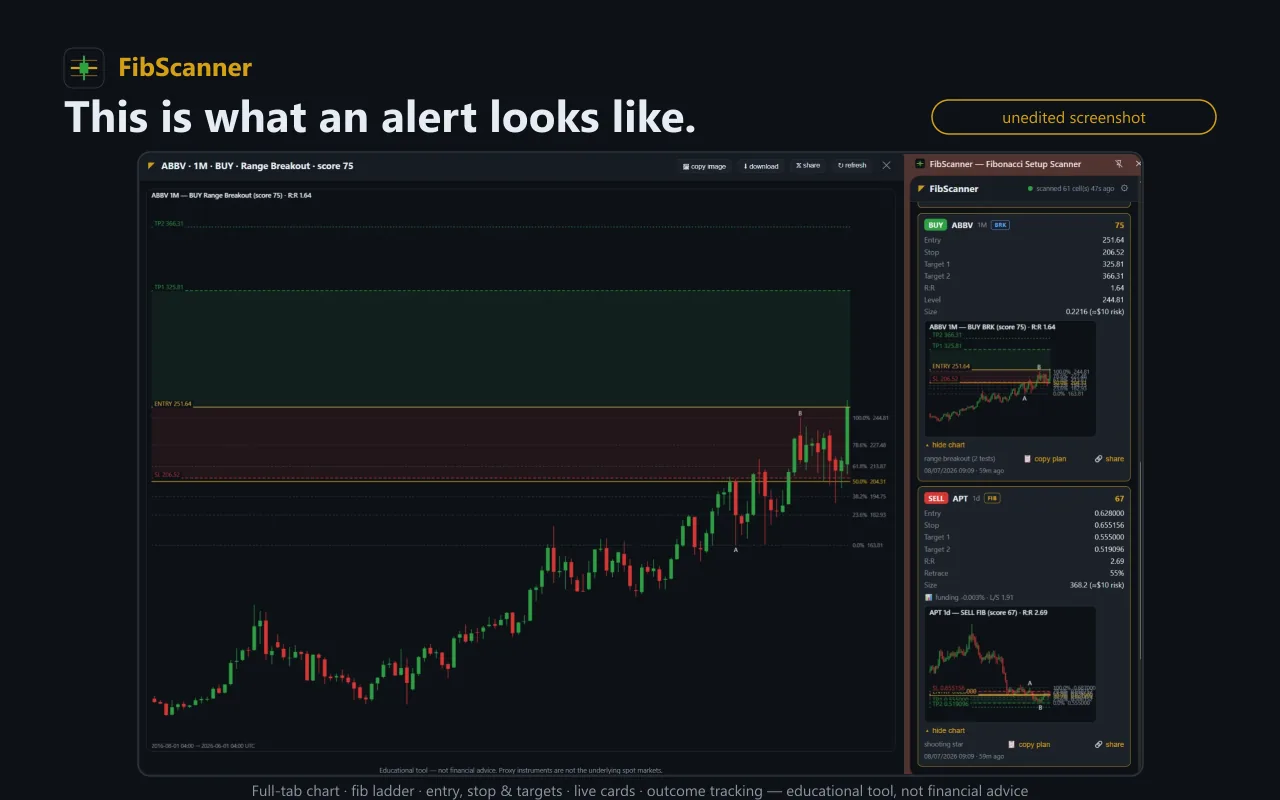
How Can a Chart Pattern Scanner Help Identify Trading Opportunities?
A Chart pattern scanner is a trading tool that helps traders identify technical patterns on price charts. Instead of manually reviewing dozens or hundreds of stocks, traders can use a scanner to find charts that match specific conditions. This approach can save time and help traders focus on potential opportunities that deserve closer analysis.
Chart patterns often reflect changes in market sentiment. Traders may look for formations such as triangles, flags, wedges, double tops, double bottoms, and head-and-shoulders patterns. A scanner can automatically search for these formations based on predefined technical criteria.
The scanner does not make a trade decision for you. Instead, it acts as a research assistant. It highlights charts that may contain useful setups, allowing you to examine price action, volume, support, resistance, and broader market conditions before entering a position.
How Can a Chart Pattern Scanner Save Traders Time?
Manual chart analysis can take considerable time, especially when a trader follows a large watchlist. Checking every chart individually can also make it difficult to maintain a consistent process.
A Chart pattern scanner automates the initial screening stage. Traders can enter their preferred conditions, and the scanner searches for instruments that meet those requirements. This allows traders to spend more time analyzing promising setups rather than searching randomly.
For example, a trader may want to find stocks forming ascending triangles near resistance. Instead of opening every chart and looking for the pattern, the scanner can narrow the list to potential candidates.
This time-saving feature becomes especially useful for active traders who monitor multiple markets and timeframes.
Which Chart Patterns Can a Scanner Identify?
Different scanners support different technical formations, but many tools focus on widely recognized chart patterns. These may include:
- Double tops and double bottoms
- Head-and-shoulders patterns
- Inverse head-and-shoulders formations
- Ascending and descending triangles
- Symmetrical triangles
- Rising and falling wedges
- Flags and pennants
- Channels
- Breakout and breakdown structures
Each pattern can provide a different perspective on potential price behavior. For example, a triangle may indicate a period of consolidation, while a breakout from that structure may signal increased market activity.
However, traders should treat pattern recognition as one part of technical analysis rather than as a guaranteed prediction of future prices.
How Does a Scanner Help Identify Breakout Opportunities?
Breakouts occur when price moves beyond an important support or resistance level. Traders often watch these events because they can signal a shift in market momentum.
A scanner can monitor multiple instruments and identify charts approaching or moving through important technical levels. Some scanners may also incorporate volume, price movement, moving averages, or other indicators to help filter potential breakout setups.
A Breakout scanner Chrome extension can make this process more convenient by bringing scanning functionality closer to the trader’s browser-based workflow. Instead of repeatedly checking individual charts, traders can use supported scanning features to locate instruments that meet selected criteria.
Still, a breakout signal requires confirmation. Traders should examine whether the price move has sufficient volume, whether the broader market supports the move, and whether the breakout remains above the relevant level.
Why Is Volume Important When Scanning Chart Patterns?
Price patterns become more informative when traders consider volume alongside price action. Volume measures the amount of trading activity behind a price movement.
Suppose a stock breaks above resistance with noticeably higher trading volume. Some traders may consider that move more convincing than a breakout that occurs with very little activity.
A scanner can help traders filter opportunities based on volume conditions. For example, users may look for stocks experiencing increased volume near a technical breakout level.
This does not guarantee that the breakout will succeed. False breakouts can still occur, and volume can increase for many reasons. Traders should combine volume analysis with price structure and risk management.
Can a Chart Pattern Scanner Reduce Emotional Trading?
Emotions can influence trading decisions. Fear may cause traders to exit too quickly, while excitement can encourage impulsive entries. Traders may also spend too much time searching for setups that confirm what they already want to believe.
A Chart pattern scanner can support a more systematic approach. Traders can define their preferred criteria before scanning the market. The tool then applies those criteria consistently.
This process can reduce random chart selection and encourage traders to follow a repeatable routine. However, the scanner itself does not eliminate emotional decisions. Traders still need discipline when deciding whether a setup meets their complete trading plan.
How Can Traders Combine Scanners With Technical Indicators?
Chart patterns become more useful when traders combine them with other forms of technical analysis. A scanner can identify potential formations, while indicators can provide additional context.
Common tools include moving averages, relative strength index (RSI), MACD, Bollinger Bands, and volume indicators. Traders may also examine support and resistance levels and recent price momentum.
For example, a trader could use a scanner to identify a bullish flag and then check whether the price remains above a key moving average. They could also examine volume and market conditions before considering an entry.
The goal is not to add as many indicators as possible. Too many signals can create confusion. A simple, consistent combination often provides a clearer decision-making process.
What Role Does a Breakout Scanner Chrome Extension Play?
A Breakout scanner Chrome extension can provide a practical way to monitor potential breakout conditions while working within a browser. Depending on the extension’s capabilities, traders may use it to identify instruments showing particular technical characteristics.
Browser-based tools can be convenient because traders can access scanning features without constantly switching between separate applications. This can make market research more efficient.
Before relying on any extension, traders should understand its supported markets, scanning criteria, data sources, update frequency, and technical limitations. A tool is most useful when traders understand exactly what its signals represent.
How Can Traders Use Scanners More Effectively?
The best results usually come from using scanners as part of a structured workflow. Traders can begin by defining the type of setup they want to find. They can then select appropriate technical filters and scan their watchlist or preferred market.
After receiving the results, traders should manually review each candidate. They can check the pattern’s structure, recent price action, volume, support and resistance, and overall market trend.
A useful workflow may look like this:
- Define a specific trading setup.
- Select relevant scanning conditions.
- Run the scanner.
- Review the strongest candidates.
- Confirm the chart pattern manually.
- Evaluate risk and potential reward.
- Follow the trading plan.
Tools such as Fibonacci Scanner can fit naturally into a research-focused workflow by helping traders organize technical market analysis. Traders should still make independent decisions based on their strategy and risk tolerance.
What Are the Limitations of Chart Pattern Scanners?
No scanner can predict the market with certainty. Pattern recognition involves interpretation, and different market conditions can produce misleading signals.
A scanner may identify a formation that appears technically valid but fails shortly afterward. Sudden news, earnings announcements, economic events, and changes in market sentiment can also affect price behavior.
Scanners may also produce false positives when price action only partially matches a pattern. For this reason, traders should never assume that every scanned result represents a high-probability trade.
Risk management remains essential. Traders should determine their position size, entry conditions, stop-loss approach, and potential exit strategy before taking a trade.
How Can Traders Turn Scanned Patterns Into Better Opportunities?
The main advantage of a scanner is not that it predicts winning trades. Its real value comes from helping traders find relevant charts faster and apply a consistent research process.
A trader can use scanning technology to narrow a large market into a manageable list of potential setups. From there, careful analysis can determine whether an opportunity actually fits the trading strategy.
With a disciplined approach, Fibonacci Scanner can be part of a broader technical-analysis routine that combines chart patterns, price action, volume, market trends, and risk management.
Ultimately, a Chart pattern scanner can help traders identify potential trading opportunities more efficiently. When combined with thoughtful analysis and disciplined risk management, it can turn a time-consuming search process into a more organized and repeatable part of market research. A Breakout scanner Chrome extension can further improve convenience for traders who prefer browser-based tools, but the final trading decision should always come from a complete evaluation rather than a single automated signal.